Home » Engineering » Standard Deviation Calculator
In today’s world, the data generated daily is enormous. Getting insights and analyzing is a crucial and important task. Here standard deviation definitely becomes useful. In this article, the calculation of standard deviation is explained.
Standard deviation, often relegated to the realm of statistics textbooks, plays a surprisingly significant role in our daily lives. This seemingly complex concept acts as a practical tool for understanding the variability in various data sets, offering valuable insights across diverse scenarios.
Standard Deviation represents the spreadness of data, or dispersion of values in data relative to the mean of the data. It is a measure of how each number is observed from the mean.
Standard deviation is an important tool in statistical and probabilistic analysis. Alone, it is not sufficient to find results and is used along with other statistical tools. In this article, an automatic standard deviation calculator is included, which is helpful for students, engineers and data analysts.
Calculator Tool
Square of Standard deviation is called Variance. It helps measure how far the data has spread out. Concept of standard deviation applies only when data follows normal distribution. We can say data graph is in bell shape.
Formula of standard deviation
![\[ \sigma = \sqrt{\frac{\sum_{i=1}^{n}{(x-\bar{x})^2}}{N}} \]](https://fineducalcs.in/wp-content/ql-cache/quicklatex.com-1eced286eaf6b0875ed6a83861b23042_l3.png "Rendered by QuickLaTeX.com")
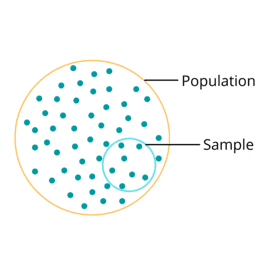
In Statistics, the statistical operations on whole data and a portion of it handled differently. Here comes the concept of sample and population. Complete or whole data is called as population i.e. the data which we are trying to analyse and make conclusions out of it. Part of the whole data is the sample.
How to calculate standard deviation using standard deviation calculator:
- Calculate mean of the data. For this add all values in data and divide by size of data.
- Subtract mean from every value and square the each resultant value, then sum all.
- Divide the final value with size of data (N). If partial data is taken for calculation, then divide final value with size of data taken minus one (n-1) instead of N.
- Then apply square root, it is the standard deviation of the data.
By knowing the standard deviation, one can get an idea of the variation that is normal or drastic. Standard deviation is used in the process of identifying the outliers of data, i.e. unusual instances of data.
Standard Deviation Example
Students Marks in a Class
Calculating standard deviation of marks obtained by students in a class, who attend a exam. All marks are listed below in ascending order. No. of students in the class is 12. Maximum marks are 100, Pass marks are 50.

List of Marks: 31, 42, 54, 56, 57, 63, 67, 75, 76, 82, 86, 91
Mean or average: 65
Subtract average from each data value
31-65, 42-65, 54-65, 56-65, 57-65, 63-65, 67-65, 75-65, 76-65, 82-65, 86-65, 91-65
-34, -23, -11, -9, -8, -2, 2, 10, 11, 17, 21, 26
Square all values
1156, 529, 121, 81, 64, 4, 4, 100, 121, 289, 441, 676
Sum above numbers
3585
Divide by total no of data values
3585/12
298.33
Square root of above value
√298.33
17.28
Std: 17.28
Graph Representation
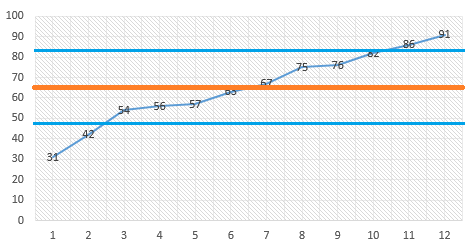
Lower and Upper standard deviation limits:
0 —47.71 — 65 — 82.28 — 100
47.71, 82.28
Observations
Standard deviation of 17 marks tells that students performance varies significantly.
Lower standard deviation spanned below into pass mark limit.
The above procedure can be used to calculate standard deviation manually or use online calculator in this page for quick calculation.
General Applications of Standard Deviation
Applications of Standard deviation is very useful in the business community especially for understanding market fluctuations, controlling inventory and explaining consumer behavior. This helps companies find out about their best and worst times. So businesses can allocate resources better to meet the client demands.
Similarly, tracking deviations in inventories can minimise stock-outs or overstocking, thereby ensuring optimum effectiveness. Moreover, knowledge about standard deviation will be helpful for businesses to understand consumer behaviour, like analyzing buying habits as well as specifying products with a high degree of demand variability.
The use of standard deviation is even wider than that. In education, it helps assess student performance through understanding how scores are dispersed within a class. For example, the statistics allow sports analysts to identify areas where players can improve on consistency in their performances. Additionally, even weather forecasting uses standard deviations for interpreting what is normal temperature and precipitation changes.
Standard deviation literacy enables us to extract meaningful information from our data surroundings. It helps us make decisions in our businesses, plan for daily life events and even deepen our knowledge about nature, among many other applications. This is so whenever you meet data with inherent variability, the next thing to consider is the power of the standard deviation.
Analyzing Monthly bills by Standard Deviation
One can do this using a standard deviation calculator that calculates the standard deviation for your monthly bills. You should enter all bill amounts for each month within the year in the above calculator and then press submit. This gives you information about how your spending varies throughout the year. High SD indicates that there are huge deviations in monthly bills, while low SD implies more stable spending tendencies.